[NEW: ACP Exam Prep Book Available - "I Want To Be An ACP" (Link)]
In the previous post, we created an Agile BurnUp Report with MS Project 2013 directly without switching to any other apps.
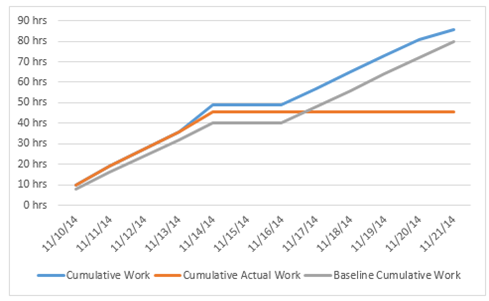
Let us analyze the graph a bit more.
- As it is baselined, the “Baseline Cumulative Work” line is shown. However, it is below Cumulative Actual Work. Hence more work has been done than actually baselined.
- The “Cumulative Work” is above the “Cumulative Actual Work”, which understandable as we have work to do, i.e., the pending work.

As you can see, the actual work field has values as we had entered in the previous post. The cumulative work by end of 1st week is 49h, whereas the cumulative actual work is 45.5h. And the baseline cumulative work is, of course, 40h.
Now, let us do a few formatting for the Labels for 3 the series of "Cumulative Work", "Cumulative Actual Work" and "Baseline Cumulative Work" and it will look as:

To perform above the customization for deeper interpretation of data, add the labels for all the lines as shown below. It is for "Cumulative Work" line. You can change the color coding from Blue to any other color as well.

After you add the Data labels, you can format the Data Labels and place them, customize them the way you want. Also from the field list, you can choose to add additional fields.

The best part in all of these - you do not need to go Excel for your reports.
Baseline is a good addition as actual work for a task might be more than initially planned (or can be less) during the Sprint and Baseline information shows - how much we have actually varied from the initially planned one.
-- Few Key Notes --
Question - Can I variants of this chart in Bar format?
Yes you can. Just change the Chart Type as shown earlier. Like it can be as shown below.

Question – Can I copy the report to another apps, say PowerPoint, directly?
Yes, you can. Use the Copy Report functionality as shown.

Question – Can I create a PDF copy?
Yes, you can. Just use the Export PDF functionality and it will work.

Some say, it is not possible to create PDF for reports. Wrong! It is possible and it works perfectly. Set your print setting properly - orientation, size and margin.
In conclusion, few may agree with you that MS Project will help you can create Agile Reports. I think it is unfair. In fact, a number of interesting fields are added like - Baseline Cumulative Work, Remaining Cumulative Work, Remaining Cumulative Actual Work, and so on - with which you can create a number of Agile specific reports.
Part - 1: How to Create an Agile BurnUp Chart with MS Project 2013?
You may also like:
You may also like:
- Agile Management with MS Project 2016
- 9 Ways to Check Critical Tasks in MS Project
- Agile Cumulative Flow Diagram (CFD) with MS Project 2013/2016
- 'Formula Bar' and 'Entry Bar' - Two Different Functionalities in MS Project
- Five Important Tips - Setting Up MS Project 2013
- Working with Multiple Baselines in MS Project 2016
No comments:
Post a Comment
Sign- or Log-in and put your name while asking queries in comments. Any comment is welcome - comments, review or criticism. But off-topic, abusive, defamatory comments will be moderated or may be removed.